Wyckoff screener

A TraderAcero tool

Stop scanning charts by hand. The radar scans them for you.

Every morning, after the daily candle closes, the radar analyses hundreds of crypto, stock, ETF, commodity, index and forex assets. Only the ones with a live Wyckoff event make it here, each with its phase, its invalidation level frozen when the event appeared, its structural projection and whether the reading is still valid. It saves you the hours of going through chart after chart looking for the structure.

14 days of Pro on the monthly plan. We'll ask for a card; nothing is charged until the trial ends. Want to see it first? See a complete reading, no account needed →

  • 5 phases, A to E, read in every structure
  • 6 markets under the same rules
  • 12 catalogue events that produce a reading
  • 0 repaints — what you see stays as it is
Sample from a real scan
AssetEvent · PhaseClarity
  • RXRX▼UTAD test · Phase C58
  • ATAI▲Sweep of the low · Phase E57
  • WFC▲Spring · Phase C57
  • PURR▼UTAD test · Phase C56

Clarity out of 100 — how closely it matches the textbook pattern. It does not predict the outcome.

Then and now

The same method. A different way of looking.

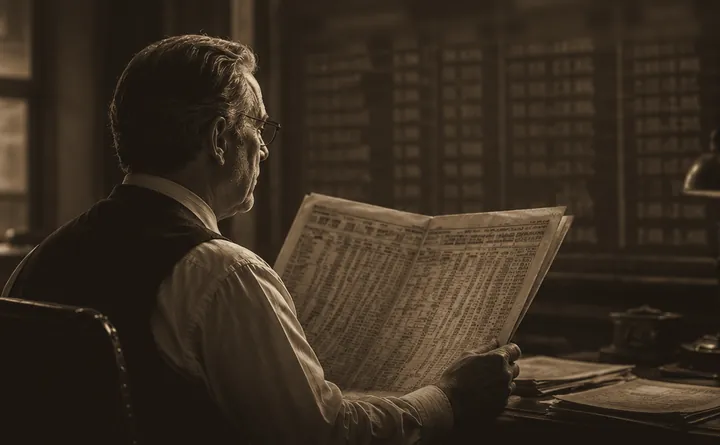
Then You searched by hand. Newspaper, chalkboard and hours, asset by asset.
Now The radar does the looking. Hundreds of assets across six markets, at every candle close.
What's different

Every event, with its place in the schematic

Each reading tells you which event it is, which phase of the schematic it falls in, the level at which its invalidation was frozen when it appeared, and whether it still stands or has already ended.

Whether the reading still stands, in plain view

Each reading tells you whether it is still valid, how many ATR away the invalidation is and how much of the path to its structural projection the price has already covered. A detected event is not a trade.

An invalidation level that stays put

The invalidation level is frozen when the reading appears, using the ATR of the event candle. It is never recalculated with today's candle — that is what separates a level you can check from one that shifts so it never fails.

Zero repaint, no exceptions

A pivot only counts once it can be confirmed. What you see on a bar is what someone looking at that same bar would have seen on the day it formed — the past is never rewritten to make the reading fit better.

The whole catalogue, always visible

The event, phase and market filters show the twelve events that produce a reading and the eight structural ones with their counts, even when one of them is at zero today. A zero is information too, so you are never left guessing.

Full lifecycle

From monitoring to activated, ending as invalidated or expired. The card follows the reading's actual path until it resolves, with what the price has done since it appeared.

Six markets, one engine

Crypto, stocks, ETFs, commodities, indices and forex, evaluated with the same rules and the same thresholds in multiples of ATR. A Spring in BTC counts exactly as much as one in EUR/USD. And where there is no reliable volume, as in spot forex, volume doesn't score and clarity is weighted only with the components that have data.

Volume Profile

Volume Profile of the range: the prices where most trading took place

Wyckoff read volume over time. The radar also reads it by price, because each structure carries its volume profile (point of control, value area and nodes), and each event is judged against it. The TraderAcero blog (in Spanish) explains how to read the VAH, the VAL and the POC.

VAH POC VAL 1 · Rejection 2 · Acceptance 3 · Defence
  1. 1

    Rejection

    Spring, UTAD, their tests, sweeps and failed breakouts

    The price leaves the value area and the confirmation closes back inside. The market rejected those prices. It is the textbook shakeout. If the extreme never left the value area, it tested nothing.

  2. 2

    Acceptance

    SOS and SOW

    The break closes outside the range's value area and stays there. Two closes in a row outside is acceptance, and with only one the radar calls it a “close outside value”. While the close stays inside the value area, the break has not yet left the area where most trading took place.

  3. 3

    Defence

    LPS and LPSY

    The pullback returns to the value area boundary and closes on the side of the break, and the old ceiling now holds as a floor; if it drops to the POC and recovers, value has been tested from inside.

  • POC as the first projection when it lies along the way, because it is the price with the most volume traded in the range.
  • Within clarity, in the volume component, with its reason written in the detail panel.
  • In the detail panel, the profile drawn over the range chart.

Built only from closed candles, with no intraday data. Each candle's volume is spread across its range, the standard approximation with daily candles. In spot forex, with no reliable volume, it isn't calculated and clarity is weighted without it. Like the rest of the reading, it describes the structure without predicting the outcome.

Product

The product, in real screenshots

The screenshots come from the product as it looks when you log in — the same scan, the same card, the same chart.

wyckoffradar.com/radar
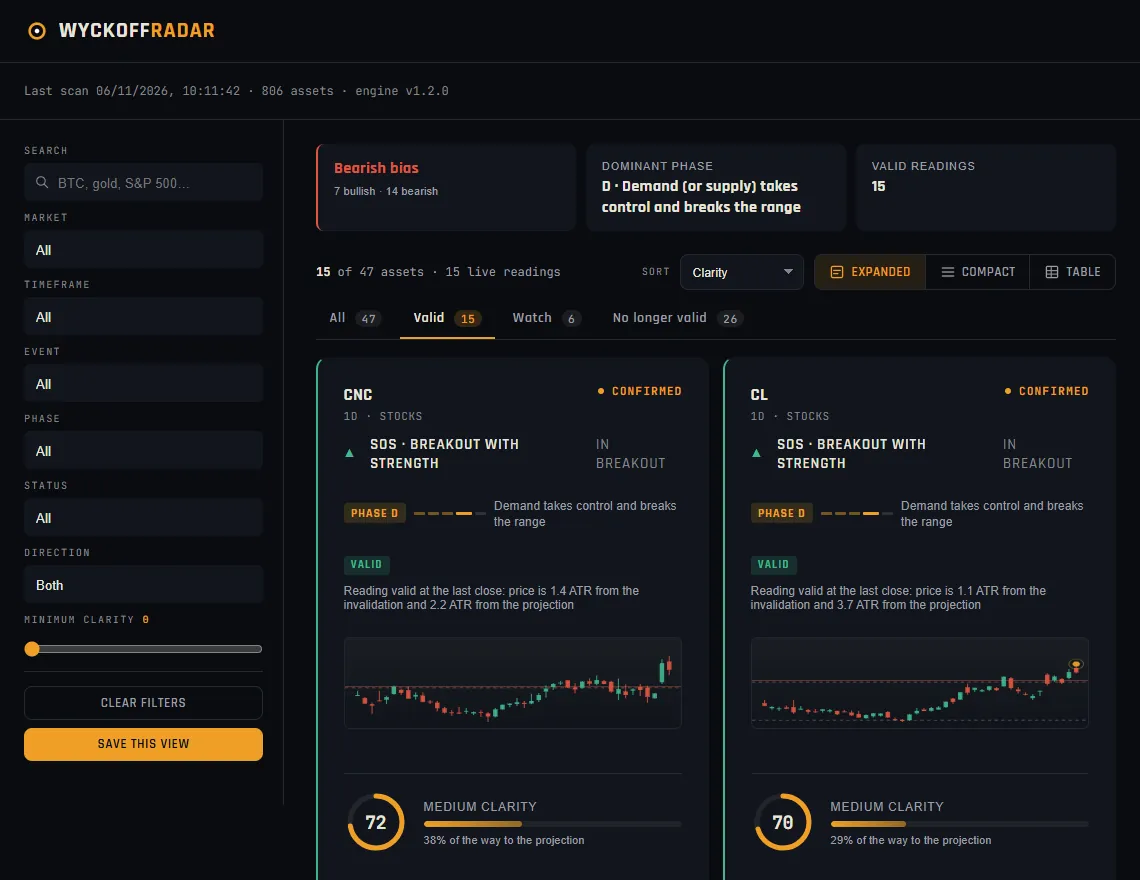
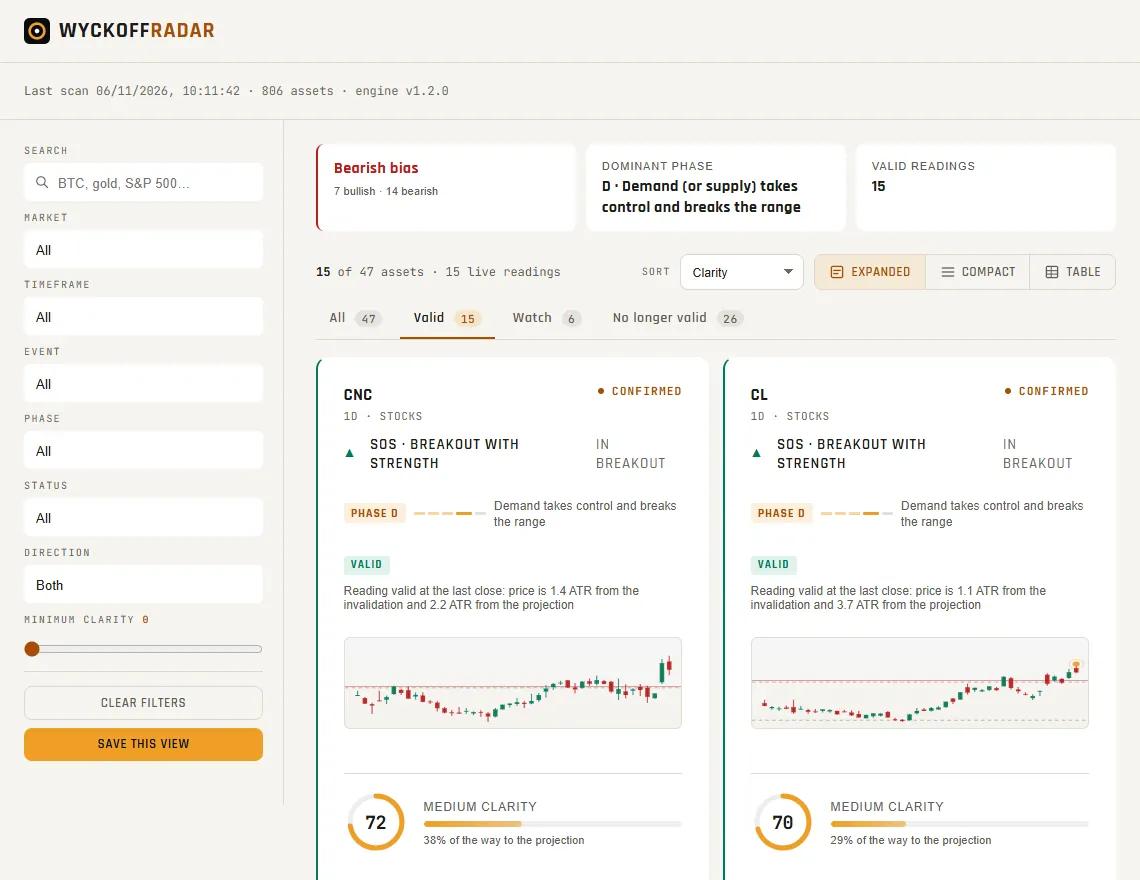
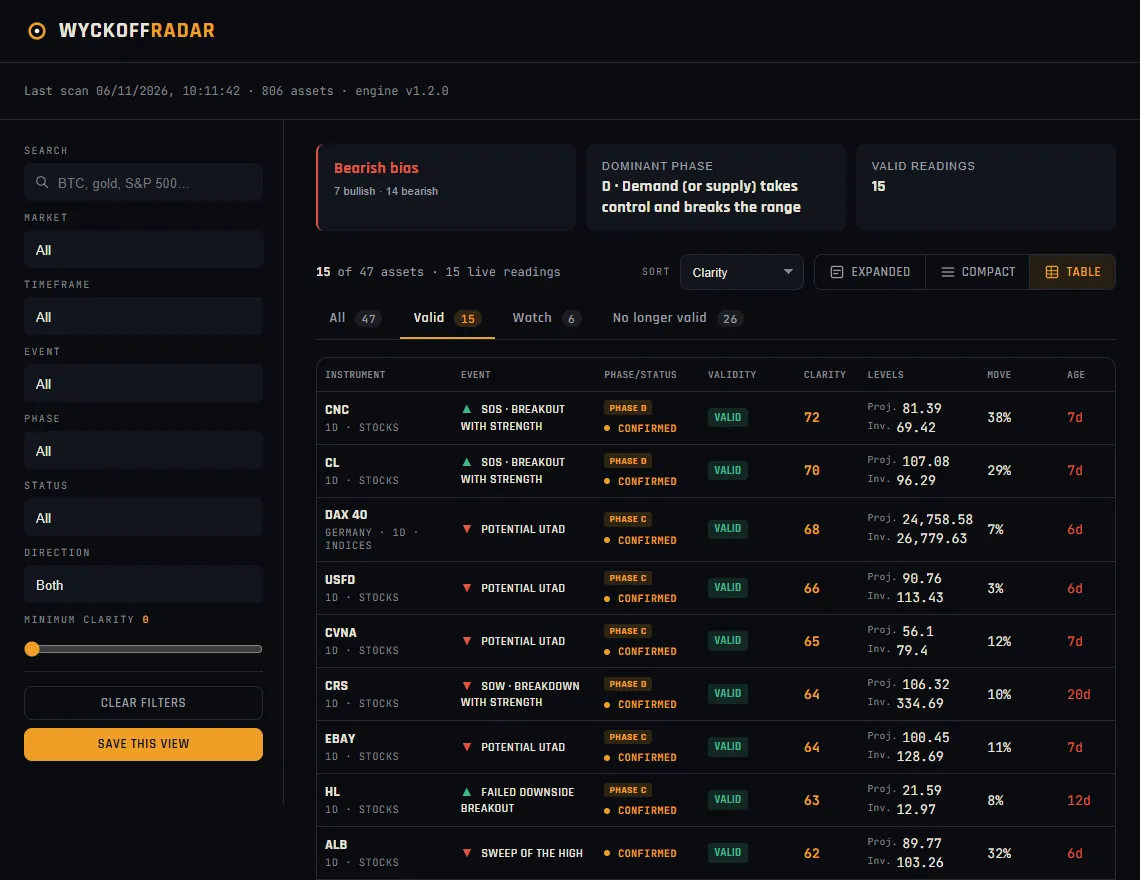
Radar feed with a bearish bias (7 bullish and 14 bearish readings), dominant phase D, 15 valid readings and the first two cards, CNC and CL, both with an SOS (breakout with strength) in Phase D and a valid reading. Radar feed with a bearish bias (7 bullish and 14 bearish readings), dominant phase D, 15 valid readings and the first two cards, CNC and CL, both with an SOS (breakout with strength) in Phase D and a valid reading.

Real scan — market reading, tabs by reading validity and the first card in the feed.

The feed: what is live right now

  • Market reading in one line — bullish or bearish bias, dominant phase and how many readings are still valid, before you read a single card.
  • Tabs by validity — all, valid, watch, no longer valid. The first cut you make, one click away.
  • Full filter — market, timeframe, event, phase, status, direction and minimum clarity. The filter state lives in the URL, so a view is a link, and a link can become an alert.
  • Each card with its own chart — the asset's real candles.
wyckoffradar.com/radar?s=…
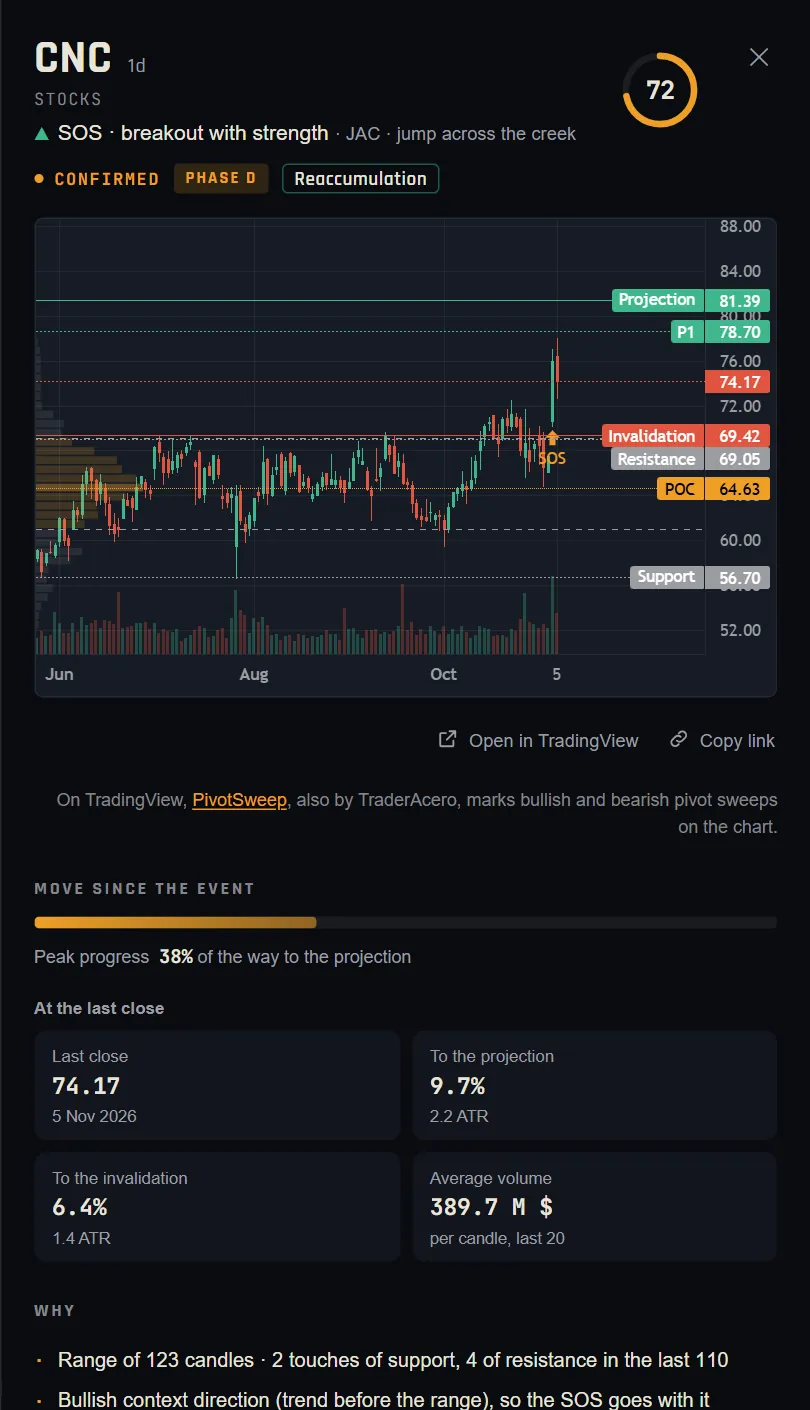
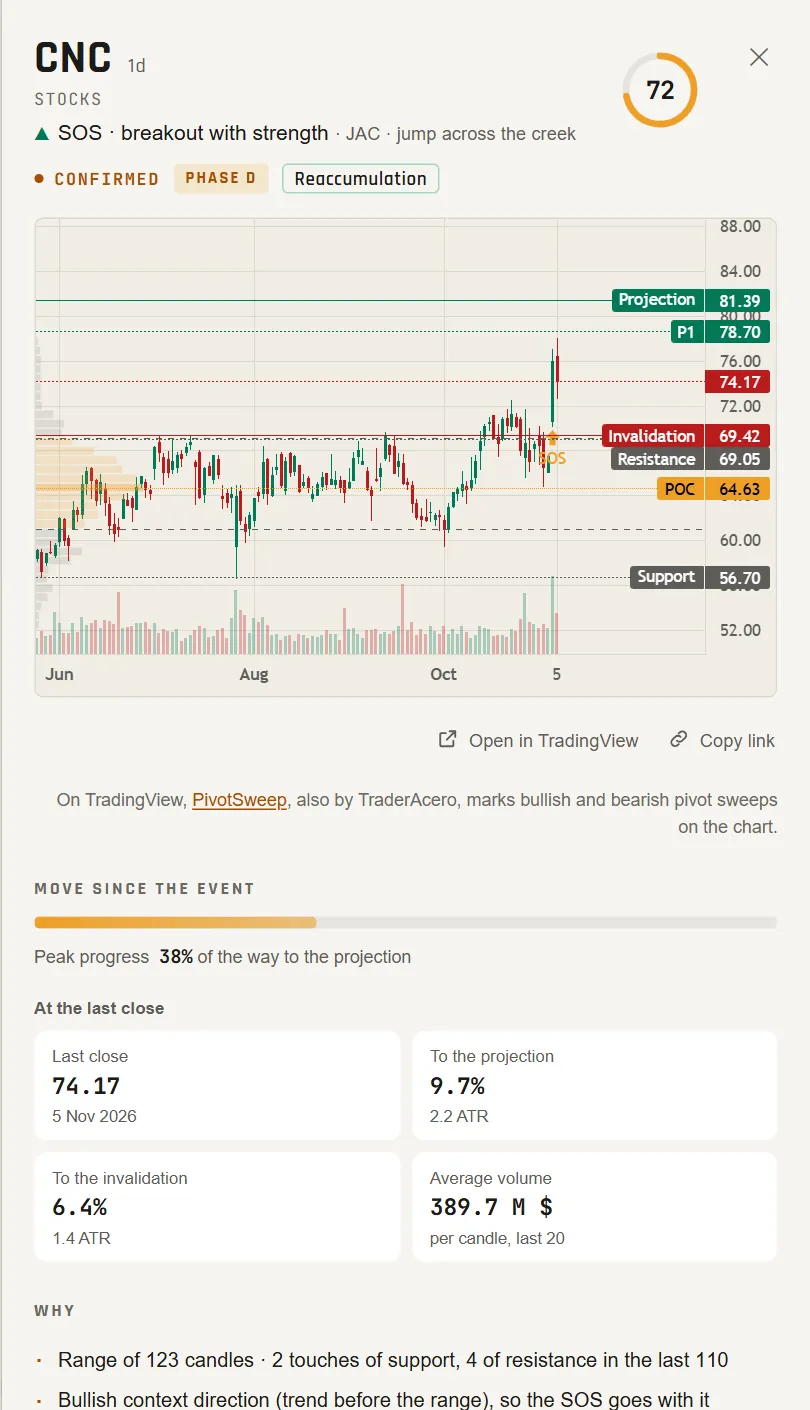
Detail panel of the CNC reading, with an SOS confirmed in Phase D, clarity 72 and a reaccumulation schematic. Below, the real chart with the range’s volume profile, the POC, the invalidation, resistance, support, P1 and the projection, the move since the event and the status at the last close. Detail panel of the CNC reading, with an SOS confirmed in Phase D, clarity 72 and a reaccumulation schematic. Below, the real chart with the range’s volume profile, the POC, the invalidation, resistance, support, P1 and the projection, the move since the event and the status at the last close.

Real scan — the detail panel of a confirmed reading, with its chart, its volume profile and its move.

The detail panel: the reasons behind each reading

  • Chart with the levels marked — invalidation, support, resistance and structural projection, over the asset's real candles.
  • Volume profile of the range — POC and value area drawn on the chart, and the event read against them as rejection, acceptance or defence.
  • Clarity by component — structure, shakeout, volume, alignment with the higher timeframe and range proportion. If a component has no data, it is dropped and the rest are renormalised; it is never filled with a neutral value.
  • The “why”, in plain language — reasons such as “penetration recovered in 2 candles” or “the weekly agrees on the downside”.
  • Direct link to TradingView to check the asset yourself first.
wyckoffradar.com/radar
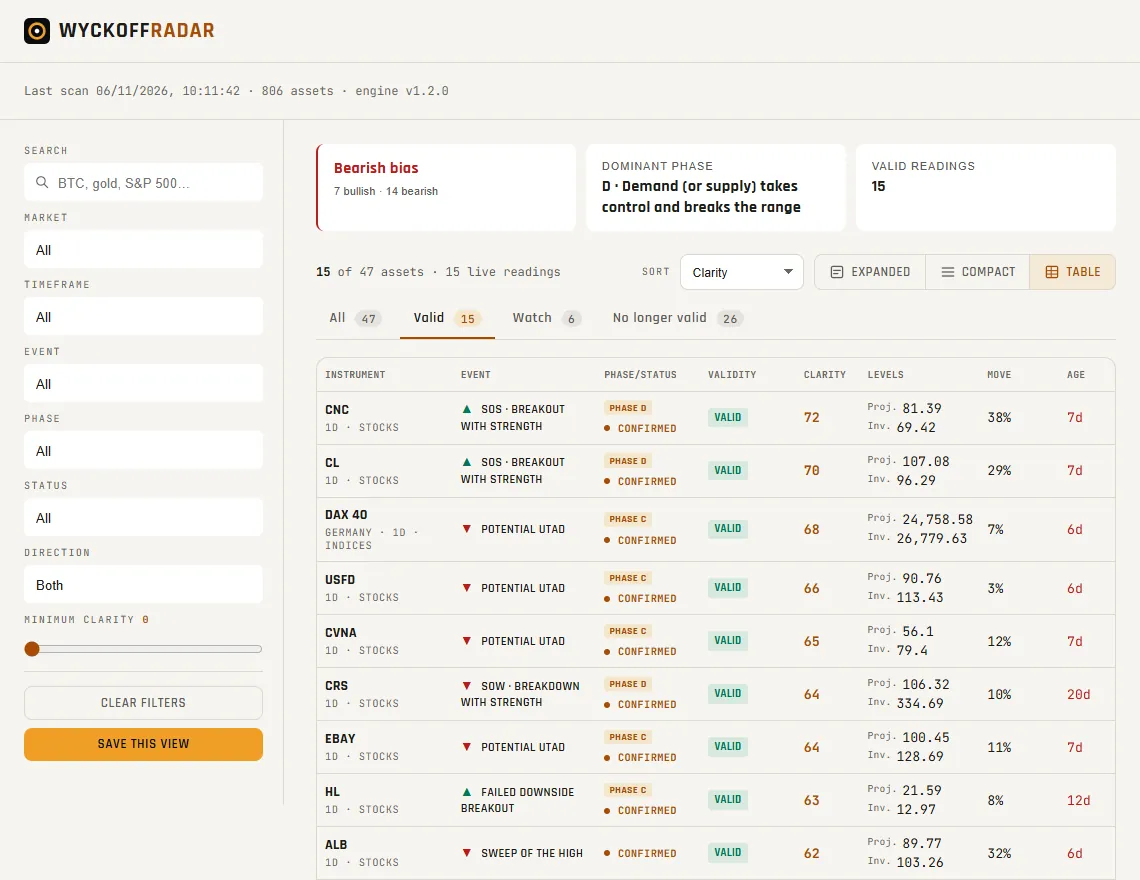
Radar table view with one row per instrument and columns for event, phase and status, reading validity, clarity, levels, move and age. It shows CNC, CL, DAX 40, USFD, CVNA and the rest of the valid readings from that scan. Radar table view with one row per instrument and columns for event, phase and status, reading validity, clarity, levels, move and age. It shows CNC, CL, DAX 40, USFD, CVNA and the rest of the valid readings from that scan.

Real scan — the same view, as a table, to go through many readings at a glance.

The table: the whole feed at a glance

  • One row per instrument — event, phase, validity, clarity, levels, move towards the projection and age, without opening each card.
  • Built for scanning — compare dozens of readings on the same screen.
  • The same data as the card — switch views and keep the active filter.
How it works

From candle to alert, in six steps

01

Scan

At every candle close, hundreds of assets across six markets — crypto, stocks, ETFs, commodities, indices and forex.

02

Build the structure

Climax, automatic rally or reaction and the tests that mark out the range, before looking at any of the events that produce a reading.

03

Resolve the phase

From what has already happened — never from what is expected. Guessing the next phase turns Wyckoff into a horoscope.

04

Detect the event

The full catalogue of Springs, UTADs, breakouts and sweeps, always with their invalidation and structural projection.

05

Measure and verify

Clarity by component and whether the reading is still valid, with the reason.

06

Alert

Only when the event is confirmed. On the radar, by email or by Telegram — you decide which filter becomes an alert.

Your time

Let the radar keep watch. You get on with your day.

Going through hundreds of charts by hand eats up the afternoon. The radar does it at every candle close and brings you only what has a live Wyckoff event, with its phase and its invalidation. You get a short list to go through calmly — and the decision is always yours.

  • One review a day — after the daily candle closes, without watching the screen.
  • Only live readings — no noise and no repaint, so what you see stays as it is.
  • Describes, doesn't recommend — it detects technical events; whether to trade is up to you.
Lifecycle

A reading isn't born confirmed

It goes through several states, and the radar follows it through each one, from the moment it appears until it resolves.

Monitoring → Shakeout → Confirmed → Testing → Activated
  • Invalidated the invalidation level has been lost. It takes precedence over any other state — an invalidated reading does not come back.
  • Expired the reading has gone too long without resolving.
Phases

The Wyckoff cycle, phase by phase

Every range the radar detects goes through the same cycle. Knowing which phase an asset is in gives an event its context, because the same break below support is an ST in Phase B and a Spring in Phase C.

SC AR ST Spring Test SOS LPS A B C D E

Illustrative schematic. The real card draws this same kind of structure over each asset's range.

A

Stopping the prior trend

The previous trend comes to an abrupt halt. The selling or buying climax (SC/BC) appears, followed by the automatic rally or reaction that traces the first range (AR) and a secondary test (ST) that confirms the climax was not noise.

B

Building the cause

The longest phase. Price travels across the range again and again while the market absorbs the remaining supply or demand — the “cause” that later turns into the move of the trend.

C

The test

The market probes the extreme of the range — a Spring below support or a UTAD above resistance — to check whether anything is left on the other side before breaking out. This is where Springs and UTADs are born, the most characteristic events of the method.

D

Demand (or supply) takes control and breaks the range

The side that has won — buyers after a Spring, sellers after a UTAD — takes control and breaks the range. The SOS jumps the creek (or the SOW breaks the ice), and the last points of support or supply (LPS / LPSY) confirm the break.

E

Trend out of the range

After the first pullback from the break (BU, LPS or LPSY), price makes a new extreme outside the range and the trend unfolds. The cause built in Phase B turns into effect, with the sweeps of lows or highs that the radar keeps watching while it lasts.

Coverage

What the radar covers

Six markets

  • Crypto
  • Stocks
  • ETFs
  • Commodities
  • Indices
  • Forex

The same engine runs on all six and treats them alike. A Spring in BTC is detected with the same rules as one in EUR/USD or the S&P 500. And each asset appears only once, so the S&P 500 isn't repeated as an index, a futures contract and an ETF.

Two timeframes

  • Daily — where readings are born.
  • Weekly — on Pro, it provides context and confirms whether the higher trend supports the daily reading. On Elite, it also produces its own readings.

Real data

  • Source — a market data provider, across all six markets.
  • Universe — stocks by actual liquidity; crypto, indices, commodities, forex and ETFs hand-curated, with well-known assets, no duplicates and no wrapped tokens.

The data provider does not guarantee availability. If a source fails on a given day, the radar says so.

It runs in the browser, the same on mobile as on desktop. The native app is under construction. It will share the engine and the readings, and the subscription will still be purchased on the website.

Plans

14 days of Pro free to get started

The 14 free days are on the monthly Pro plan. We ask for a card and billing starts when the trial ends. Pro and Elite are paid monthly or yearly, with no minimum term, and you can cancel from your subscription panel in one click. Launch price: subscribe before 30 November and you keep your price for as long as you stay subscribed.

Elite

€59/month

For traders who live in the market.

  • Everything in Pro
  • Also scans the weekly (1W), with its own readings
  • Email and Telegram alerts when an event is confirmed
  • 50 saved views instead of 5
One-off payment

Lifetime

€1,490 once

Everything in Elite for a single payment.

  • Everything in Elite
  • No renewals or future charges
  • Price locked in even if subscription prices rise

Monthly prices, taxes included — yearly with two months off.

Who's behind it

A TraderAcero tool

TraderAcero trades with the Wyckoff method and Volume Profile on NinjaTrader 8 and TradingView, using its own tools. WyckoffRadar is the missing piece. It applies the same method every day to hundreds of assets at once, so you don't have to search chart by chart.

Also from TraderAcero

  • PivotSweep
  • MarketContext
  • TradePlanner
  • OrderReplicator

Tools for NinjaTrader 8 and TradingView

Before you start

Frequently asked questions about WyckoffRadar

What is WyckoffRadar?

A Wyckoff event screener (or scanner) built by TraderAcero. Every morning it goes through hundreds of crypto, stock, ETF, commodity, index and forex assets and shows you the ones with a live Spring, UTAD, breakout or other event from the catalogue, with its phase, its invalidation level and its structural projection.

Does the radar tell me when to buy or sell?

No. WyckoffRadar detects technical events and calculates an invalidation level and a structural projection for each one. The trading decision (whether to trade, when and with what size) is always yours.

Where does the data come from?

From a market data provider, across all six markets. The stock universe is ranked by actual liquidity; crypto, indices, commodities, forex and ETFs are hand-curated, with a single instrument per asset.

Can I connect my TradingView account?

No. TradingView has no public API for that, and any shortcut would involve scraping, which we rule out. Every reading does have a direct link to TradingView so you can check the asset yourself.

How often is the radar updated?

Once a day, in the morning (Spanish mainland time), after the daily candle closes, with the weekly as context. The engine never repaints, so what you see on a confirmed bar doesn't change afterwards.

How do I cancel my subscription?

From your own subscription panel, in one click. No calls, no minimum term and no need to write to support to cancel. You keep full access until the end of the period already paid; after that, you lose access to the radar completely — there is no free or delayed version — and you can subscribe again whenever you like.

What sets the Elite plan apart?

Everything in Pro, plus its own readings on the weekly (1W), which on Pro only provides context for the daily; alerts by email and Telegram as soon as a reading is confirmed (Pro saves and organises filters and can receive a daily email summary); and 50 saved views instead of 5.

How does the 14-day Pro free trial work?

It applies only to the monthly Pro plan. We ask for a card when you start, and the monthly Pro fee is charged automatically when the 14 days end, unless you cancel before then from your subscription panel. The trial is granted only once per customer.

Is WyckoffRadar a TradingView indicator?

It's a screener that runs in your browser, with nothing to install on your platform. Every morning it scans the six markets, and each reading links to its chart on TradingView so you can check it there. TraderAcero also has its own tools for TradingView and NinjaTrader 8, at traderacero.com.

What happens to the lifetime plan if WyckoffRadar ceases to exist?

We would notify you by email at least 90 days in advance, barring force majeure. If the closure happened within 36 months of your purchase, we would refund the pro-rata share of the unused time, counting the payment as 36 months of Elite; after those 36 months there is no refund for the closure. The full conditions are in the lifetime plan terms.